Dashboard
An easy to use visual analysis tool that lets you see the whole picture in order to assess business performance, monitor trends and identify improvement opportunities.

Functionalities & benefits
Connect and view your data in minutes with intuitive dashboard tools that focus on your essentials.
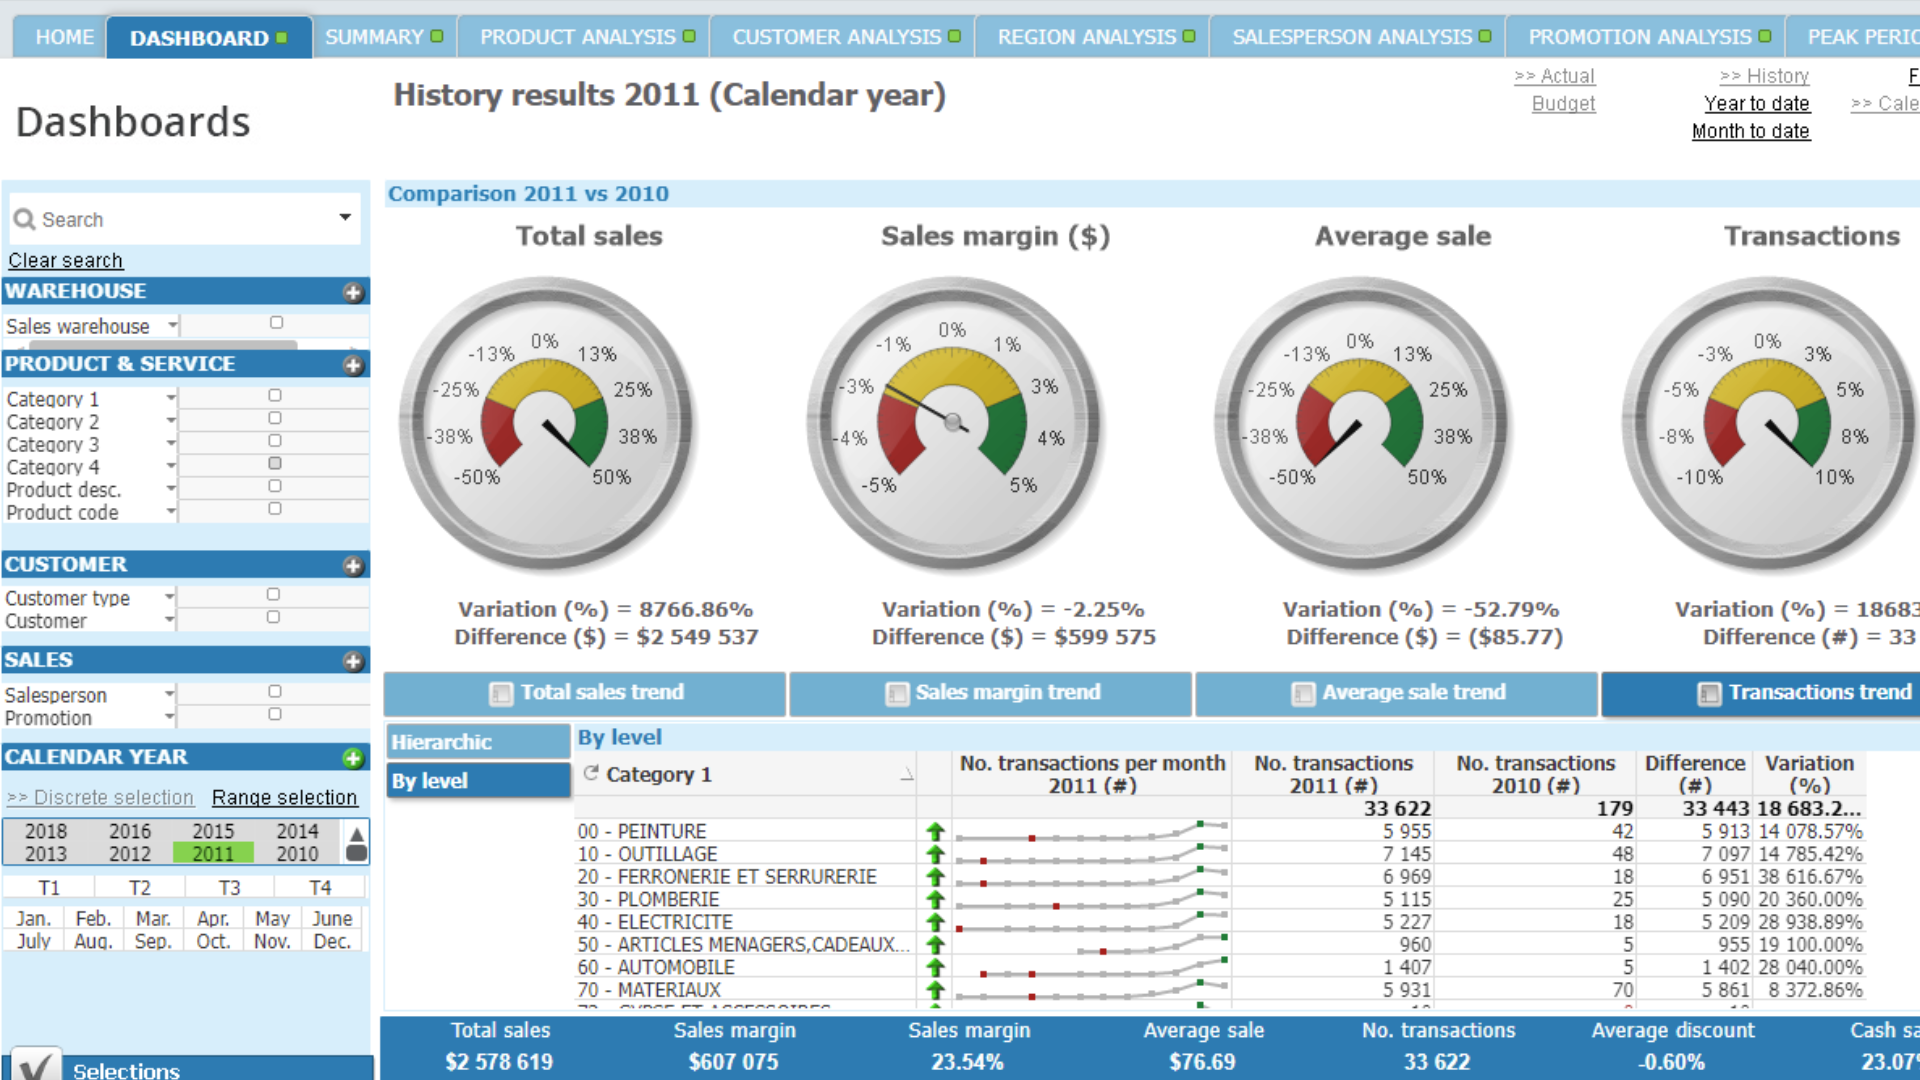
See the big picture and underlying details of your business in one quick glance using synthesized views that display information from multiple reports.
Create and save your favorite views and reports effortlessly. Our intuitive dashboards make it easier to track and share your sales and inventory data with visual information and detailed reports.
With all the information you need in one place, analyze data fast for actionable insights.
Data mining for detailed analysis has never been easier. Spend less time poring over spreadsheets and pulling outdated reports and get real-time strategic metrics working for you faster.
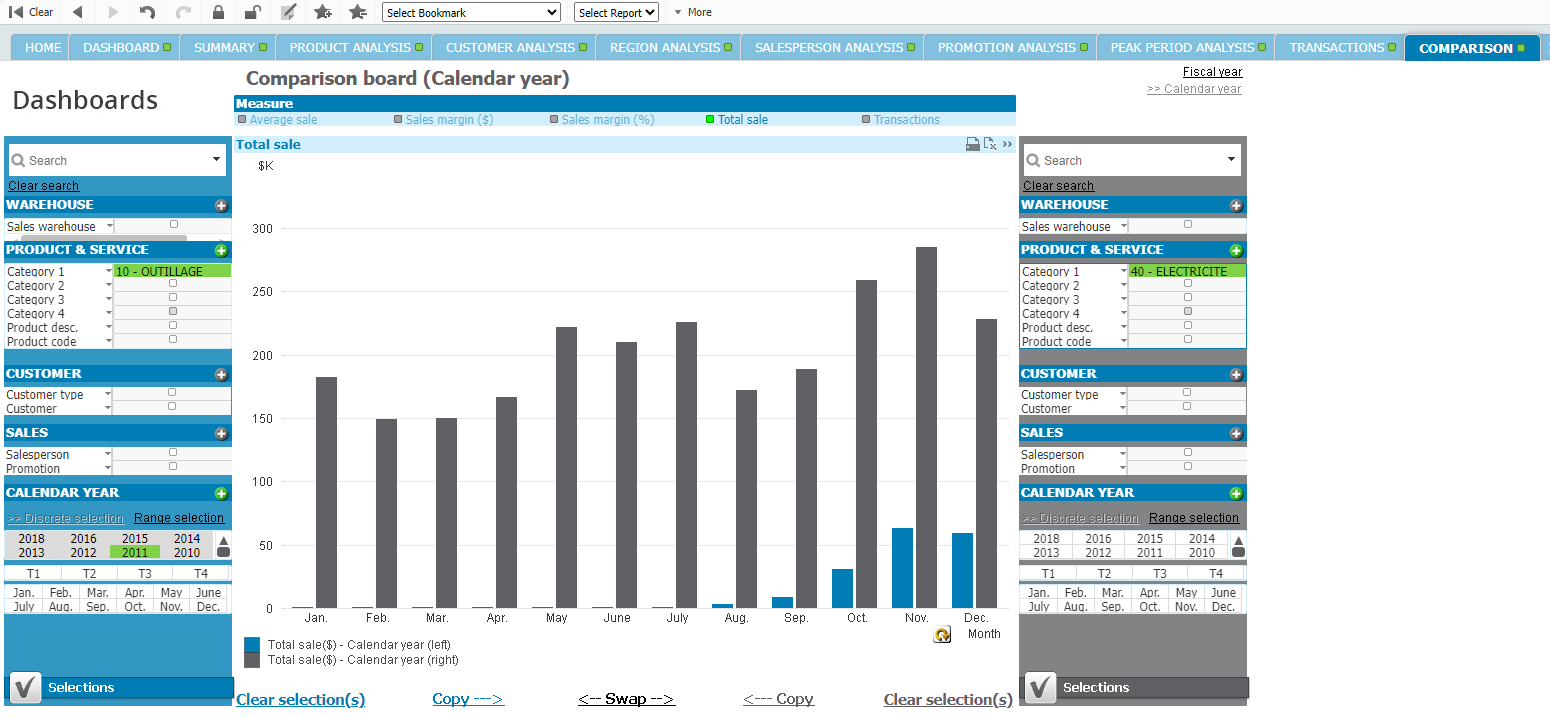
Select any period for analysis (year, quarter, week, day) and compare with a previous period or against your budget.
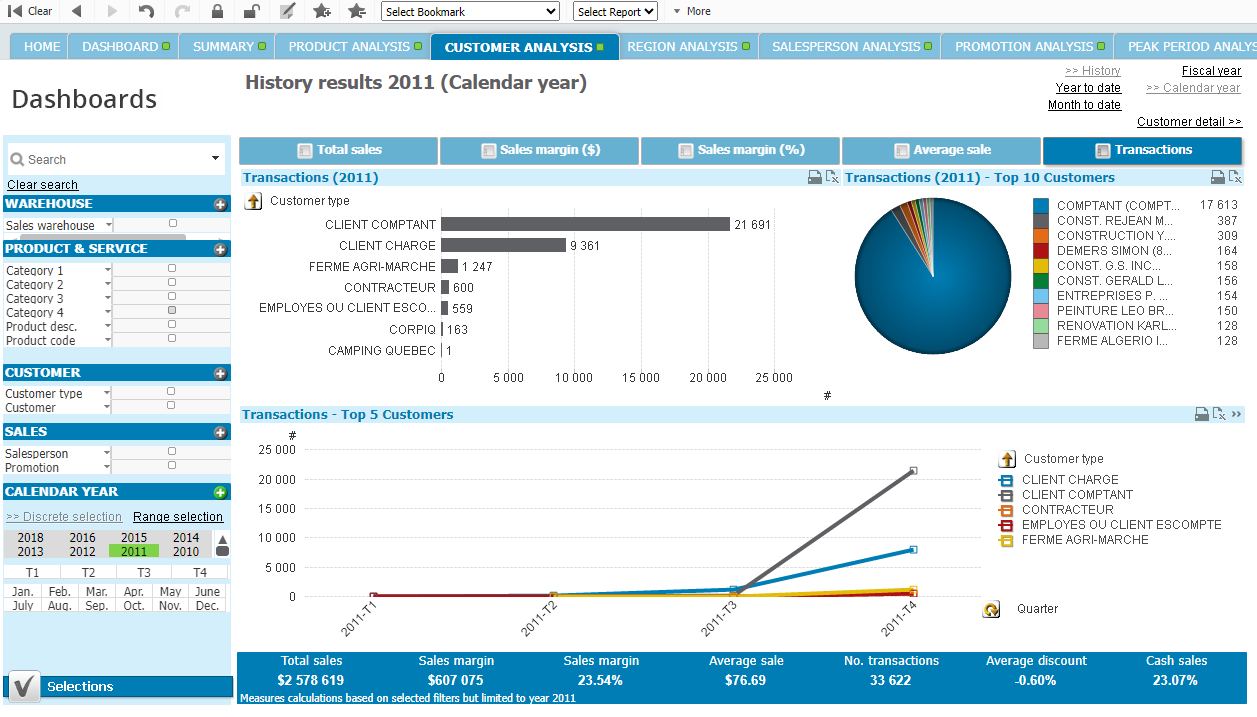
Choose any store, category, or customer group and mine your data in detail to clarify specific situations. Export data to Excel or any other tool for additional analysis with a single click.
Make informed decisions by instantly spotting trends that help you uncover opportunities and risks.
Track sales trends that allow you to stay one step ahead of competitors. Keep customers satisfied by ensuring the products they’re most interested in are fully stocked and priced appropriately.
Gain actionable insights by performing sales trend analysis with essential ratios and performance indicators. Predict trends that standard reporting may have missed.
Drill down to sales of a specific product or location to assist with strategic planning.

Track your objectives and measure them against your key performance indicators (KPIs).
The Dashboard add-on unifies tracking and analysis capabilities within a single platform to help you make data-driven adjustments in real-time to improve performance.
Hit your KPI targets and enjoy the confidence in your ability to make quick-action decisions backed by your own data.

Take the guesswork out of inventory management and ensure optimal order quantities based on automated analytics.
Optimized inventory sells faster, picks faster and ships faster. Effectively prioritize your attention and resources where it matters most by creating ABC analysis scenarios and graphs to optimize your inventory.
Obtain a quick overview of inventory turnover ratio and gross profit ratio. Do away with inventory shortages and overages with detailed information provided by the Dashboard add-on.
View stock evaluation, cost, margins, and quantities for each product instantly.
Maximize planning, purchasing, and marketing decisions using more granular data by applying filters to your dashboard views.

