
Gain control of your data!

Gain control of your data!
There’s nothing better than seeing your own information in a beautiful pie chart or graph. If you’re visual like me, seeing things in a graphic alongside the details is a great way to visualize, absorb, and present your information. Data is the basis of Business Intelligence, the perfect tool to make the best decisions, to help your business to grow.
Take this sample piece of data shown below. It’s a very structured list of data with interesting information, but it may be difficult to quickly gain the important details that you are looking for.
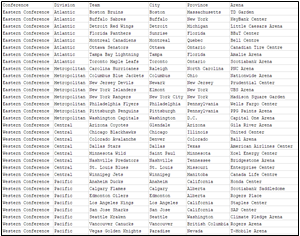
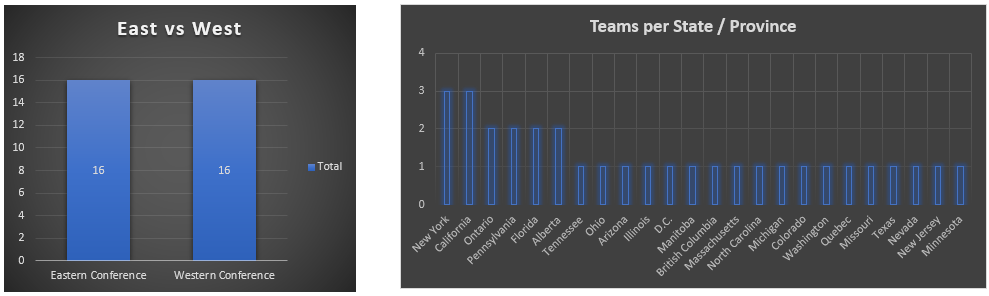
Transforming it into a chart or graph can give you great insights—information that you can’t get from just looking at a list.
How can you transform your data? Follow these easy 5steps:
- Generate your source data. Run your report in a way that gives you the details that will provide you the information you need. Date, invoice details (product, department, quantity, and price), and customer information are all great starting points.
- Make sure your data is clean. Your data should be in clean columns and rows with no merged data. For example, city and province should be in two separate columns, not combined into one. Your columns should contain a title on the top row to describe the column.
- Import your data into a spreadsheet tool. Microsoft Excel being the most common tool, Google Sheets, and Power BI can also be just as useful.
- Start creating! Use powerful features such as PivotTables and PivotCharts to summarize and format data into groups of information that are meaningful to you. Add slicers to be able to filter data quickly and easily.
- Remember your steps. Remember the source data and the cleanup steps used in points 1 and 2 so that you can easily recreate the graphics again and again. Once you have your template set up, dropping in a new set of data won’t take as much time as it did the first time.
Transforming data gets even more easy with X9
It takes a bit of time to get the hang of it but once you’ve created something that works for you, you’ll be happy that you took the time to build it in the first place. YouTube is a great place to learn how to use different features of your spreadsheet program, just searching for “How to create a PivotTable in Excel” gives you many great tutorials. There is no “one size fits all” in data transformation and analytics; you need to try things in order to get the results that talk to you!
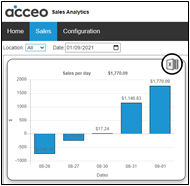
At ACCEO, we recognize the importance of being able to access your data. More and more we are putting the control in your hands to be able retrieve your data so that you can create the charts and graphs that are meaningful to you. X9 comes with a feature where you can open reports directly in Excel without the extra steps of converting your raw information (usually ASCII) to a CSV (comma separated value) file and then into an Excel format. A few clicks and your data is available and automatically opened in Excel. Also, in X9 we’ve created a Sales Analytics tool: a web browser application, which means it can be used on a desktop or a mobile device, that looks at your sales data and turns it into graphs highlighting key performance indicators (KPIs). The information is already in graphical format however, you can also choose to open the data into Excel so you can further evaluate the details you need.
Whether you’re a details or a high-level type of person, try out some of these features in X9. Have patience while you learn about all the amazing spreadsheet features out there. Try, learn and have fun!
Interested?
Other articles